Data gathered: December 26
Alternative Data for Kellogg's
| Alternative Data | Value | 3m Change | Trend | Benchmark |
|---|---|---|---|---|
| Job Posts | 1 | Sign up | Sign up | Sign up |
| Sentiment | 75 | Sign up | Sign up | Sign up |
| Webpage traffic | 538,000 | Sign up | Sign up | Sign up |
| Employee Rating | 78 | Sign up | Sign up | Sign up |
| Google Trends | 60 | Sign up | Sign up | Sign up |
| Patents | 55 | Sign up | Sign up | Sign up |
| 4chan Mentions | N/A | Sign up | Sign up | Sign up |
| Instagram Followers | 111,828 | Sign up | Sign up | Sign up |
| Pinterest Followers | 2,875 | Sign up | Sign up | Sign up |
| Reddit Mentions | 1 | Sign up | Sign up | Sign up |
| Stocktwits Mentions | 1 | Sign up | Sign up | Sign up |
| Stocktwits Subscribers | 4,206 | Sign up | Sign up | Sign up |
| Twitter Followers | 72,302 | Sign up | Sign up | Sign up |
| Twitter Mentions | 72 | Sign up | Sign up | Sign up |
| Youtube Subscribers | 9,940 | Sign up | Sign up | Sign up |
| News Mentions | N/A | Sign up | Sign up | Sign up |
| Customer reviews | N/A | Sign up | Sign up | Sign up |
| ESG | 79 | Sign up | Sign up | Sign up |
| Business Outlook | 68 | Sign up | Sign up | Sign up |
| Linkedin Employees | 15,440 | Sign up | Sign up | Sign up |
About Kellogg's
The Kellogg Company, doing business as Kellogg's, is an American multinational food manufacturing company headquartered in Battle Creek, Michigan, United States.

| Price | $81.11 |
| Target Price | Sign up |
| Volume | 909,350 |
| Market Cap | $27.9B |
| Year Range | $55.4 - $81.11 |
| Dividend Yield | 2.83% |
| PE Ratio | 27.03 |
| Analyst Rating | 0% buy |
| Industry | Packaged Foods |
In the news
Kellanova stock rises Tuesday, still underperforms marketDecember 24 - MarketWatch |
|
Kellanova stock rises Monday, still underperforms marketDecember 23 - MarketWatch |
|
 |
Shelf-Stable Food Stocks Q3 Teardown: Kellanova (NYSE:K) Vs The RestDecember 22 - Yahoo |
 |
Is Kellanova (K) the Best Cookies and Crackers Stock to Buy Now?December 21 - Yahoo |
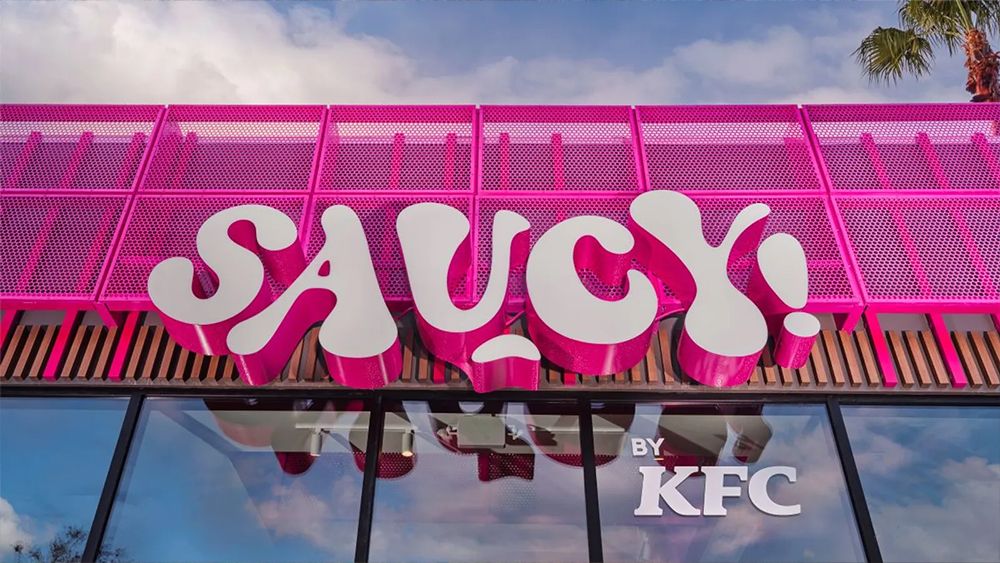 |
Is KFC's Saucy new brand genius or desperation?December 21 - Creative Bloq |
 |
Snacking in a Winter Wonderland: Kellanova's Holiday SpecialsDecember 19 - Yahoo |
Financial performance View All
| Revenue | Cost of Revenue | Gross Profit | Net Income | ebitda | EPS | |
|---|---|---|---|---|---|---|
| Q3 '24 | 3.23B | 2.78B | 456M | 367M | 456M | 0.910 |
| Q2 '24 | 3.19B | 2.7B | 493M | 344M | 608M | 1.010 |
| Q1 '24 | 3.2B | 2.87B | 333M | 267M | 522M | 1.010 |
| Q4 '23 | 3.17B | 2.08B | 1.1B | 27M | 409M | 0.780 |
| Q3 '23 | 3.26B | 2.15B | 1.11B | 269M | 570M | 1.030 |
Insider Transactions View All
| KELLOGG W K FOUNDATION filed to sell 48,878,693 shares at $80.6. December 23 '24 |
| KELLOGG W K FOUNDATION filed to sell 48,993,276 shares at $80.7. December 16 '24 |
| KELLOGG W K FOUNDATION filed to sell 49,107,859 shares at $80.7. December 9 '24 |
| KELLOGG W K FOUNDATION filed to sell 49,222,442 shares at $81.2. November 29 '24 |
| KELLOGG W K FOUNDATION filed to sell 49,337,025 shares at $81. November 21 '24 |
Similar companies
| Company | Price | AI Score | |
|---|---|---|---|
 |
General MillsGIS |
$63.76 0.2% | 47 |
 |
Kraft Heinz CompanyKHC |
$30.55 0.1% | 41 |
 |
FreshpetFRPT |
$146.06 0.6% | 54 |
 |
Lamb WestonLW |
$65.28 5% | 56 |
 |
Vital FarmsVITL |
$37.72 4.1% | 41 |
Congress Trading View All
| Politician | Filing Date | Type | Size |
|---|---|---|---|
| Rohit Khanna Democrat |
Jun 5, 24 | Buy | $1K - $15K |
| Rohit Khanna Democrat |
Mar 6, 24 | Sell | $1K - $15K |
| Rohit Khanna Democrat |
Feb 5, 24 | Buy | $1K - $15K |
Read more about Kellogg's (K) and their ai stock analysis, price prediction, earnings, congress trading, insider transactions, technical analysis, job posts, sentiment, webpage traffic, employee rating, google trends, patents, 4chan mentions, instagram followers, pinterest followers, reddit mentions, stocktwits mentions, stocktwits subscribers, twitter followers, twitter mentions, youtube subscribers, news mentions, customer reviews, business outlook & linkedin employees.
What is the Market Cap of Kellogg's?
The Market Cap of Kellogg's is $27.9B.
What is Kellogg's' PE Ratio?
As of today, Kellogg's' PE (Price to Earnings) ratio is 27.03.
What is the current stock price of Kellogg's?
Currently, the price of one share of Kellogg's stock is $81.11.
How can I analyze the K stock price chart for investment decisions?
The K stock price chart above provides a comprehensive visual representation of Kellogg's' stock performance over time. Investors can use this chart to identify patterns, trends, and potential support or resistance levels. By examining historical data and recent price movements, investors can make more informed decisions regarding buying, holding, or selling Kellogg's shares. Our platform offers an up-to-date K stock price chart, along with technical data analysis and alternative data insights.
Does K offer dividends to its shareholders?
Yes, Kellogg's (K) offers dividends to its shareholders, with a dividend yield of 2.83%. This dividend yield represents Kellogg's' commitment to providing value to its shareholders through both potential capital appreciation and steady income. Investors considering Kellogg's in their portfolio should factor in this dividend policy alongside the company's growth prospects and market position.
What are some of the similar stocks of Kellogg's?
Some of the similar stocks of Kellogg's are General Mills, Kraft Heinz Company, Freshpet, Lamb Weston, and Vital Farms.
.