Data gathered: October 25
AI Stock Analysis - Novo Nordisk (NVO)
Analysis generated September 30, 2025. Powered by Chat GPT.
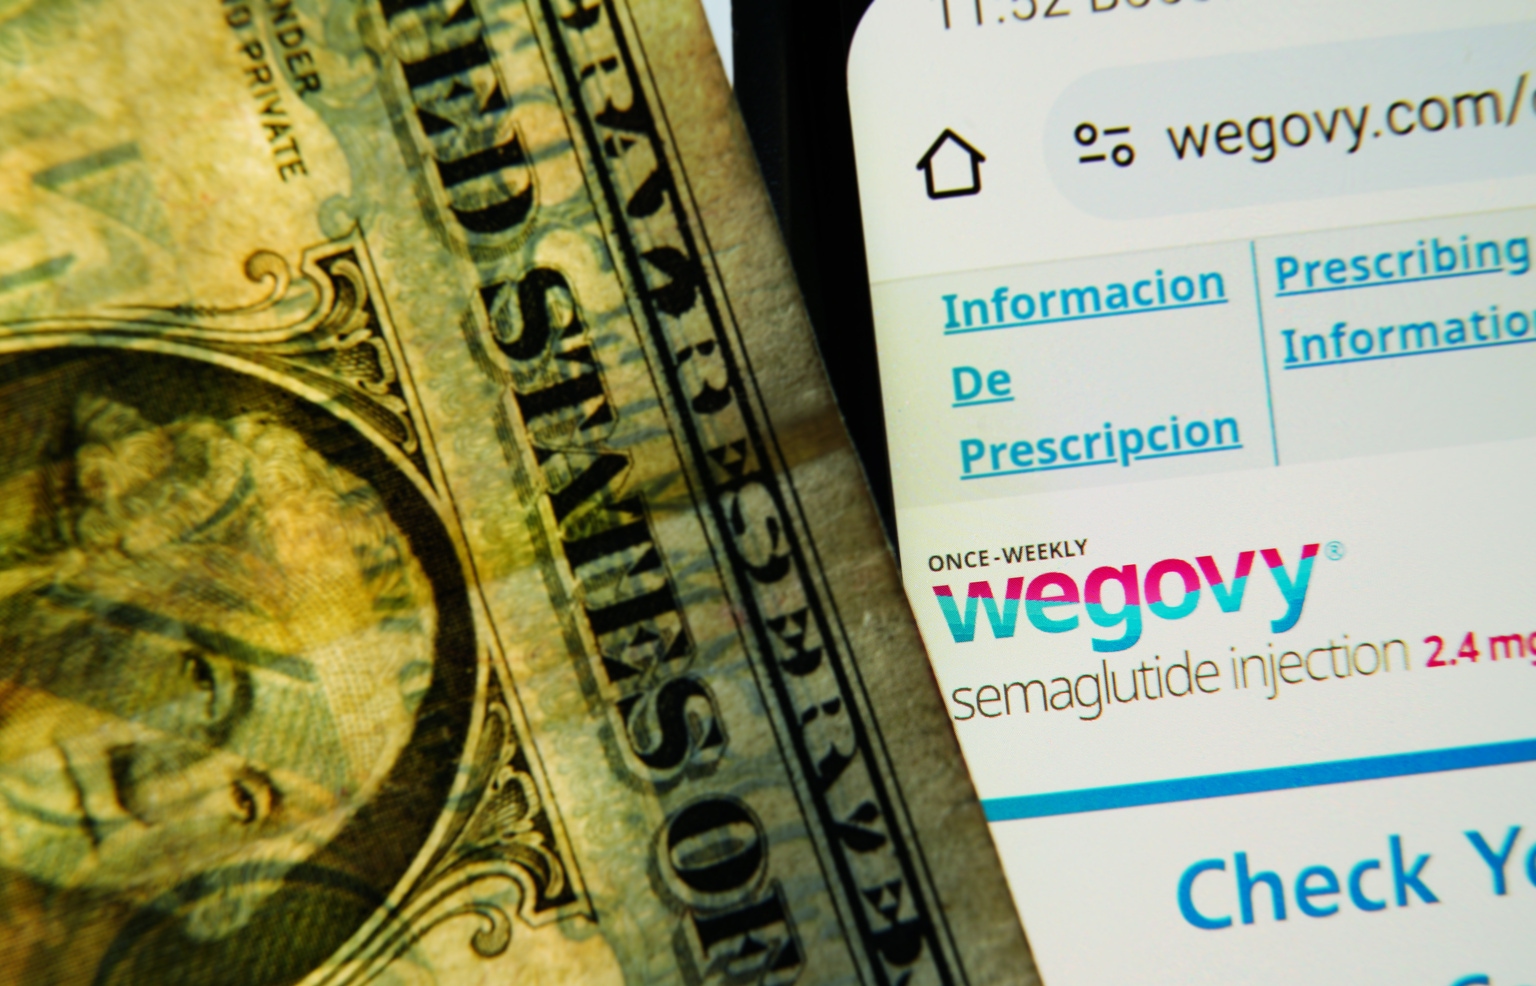
Novo Nordisk is a global healthcare company founded in Denmark, known for its diabetes care products, including insulin and GLP-1 receptor agonists. In addition to diabetes care, the company works in the areas of hemophilia, growth disorders, and obesity. Novo Nordisk is a prominent player in the pharmaceutical industry, leveraging its strong research and development capabilities to introduce innovative therapies to the market.
Stock Alerts - Novo Nordisk (NVO)
 |
Novo Nordisk | October 24 Lisa McClain (member of U.S. congress) is buying shares |
|
Novo Nordisk | October 22 Reddit mentions are up by 107% in the last 24h. |
|
Novo Nordisk | October 21 Marjorie Taylor Greene (member of U.S. congress) is buying shares |
|
Novo Nordisk | October 18 Reddit mentions are up by 201% in the last 24h. |
Download our app to get future alerts delivered in real-time.
Alternative Data for Novo Nordisk
About Novo Nordisk
With almost 50% market share by volume of the global insulin market, Novo Nordisk is the leading provider of diabetes-care products in the world. Based in Denmark, the company manufactures and markets a variety of human and modern insulins, injectable diabetes treatments, and oral antidiabetic agents.
| Price | $52.96 |
| Target Price | Sign up |
| Volume | 8,290,000 |
| Market Cap | $237B |
| Year Range | $44.89 - $88.57 |
| Dividend Yield | 3.24% |
| PE Ratio | 13.72 |
| Analyst Rating | 57% buy |
| Earnings Date | November 5 '25 |
| Industry | Drug Manufacturers |
In the news
 |
P/E Ratio Insights for Novo NordiskOctober 24 - Biztoc.com |
 |
The Power Behind the Scenes at Novo Nordisk Is Back on TopOctober 24 - Biztoc.com |
 |
Novo Nordisk: Decade-Low Valuation Meets A Billion-Patient MarketOctober 24 - SeekingAlpha |
 |
Novo Nordisk's Lottery Ticket Against Alzheimer's DiseaseOctober 23 - SeekingAlpha |
 |
Novo Nordisk Boardroom Clean-Out Is Rare Case of Director AccountabilityOctober 23 - Biztoc.com |
 |
Mixed options sentiment in Novo Nordisk with shares down 0.59%October 23 - Thefly.com |
Financial performance View All
| Revenue | Cost of Revenue | Gross Profit | Net Income | ebitda | EPS | |
|---|---|---|---|---|---|---|
| Q2 '25 | 76.9B | 12.8B | 64B | 26.5B | 43.6B | 5.960 |
| Q1 '25 | 78.1B | 12.9B | 65.2B | 29B | 46B | 6.530 |
| Q4 '24 | 85.7B | 13B | 72.7B | 28.2B | 44.3B | 6.340 |
| Q3 '24 | 71.3B | 11.3B | 60B | 27.3B | 37.4B | 6.120 |
| Q2 '24 | 68.1B | 10.3B | 57.8B | 20.1B | 35.7B | 0.660 |
Insider Transactions View All
No recorded Insider transactions.
Similar companies
| Company | Price | AI Score | |
|---|---|---|---|
 |
Johnson & JohnsonJNJ |
$190.4 0% | 66 |
 |
Eli Lilly and CompanyLLY |
$825.45 0% | 62 |
 |
PfizerPFE |
$24.76 0% | 65 |
 |
AstrazenecaAZN |
$83.29 0% | 61 |
 |
AbbVieABBV |
$227.99 0% | 63 |
Congress Trading View All
| Politician | Filing Date | Type | Size |
|---|---|---|---|
| Lisa McClain |
Oct 22, 25 | Buy | $1K - $15K |
| Marjorie Taylor Greene |
Oct 21, 25 | Buy | $1K - $15K |
| Lisa McClain |
Sep 15, 25 | Sell | $1K - $15K |
Read more about Novo Nordisk (NVO) and their ai stock analysis, price prediction, earnings, congress trading, insider transactions, technical analysis, job posts, sentiment, webpage traffic, employee rating, google trends, patents, 4chan mentions, facebook engagement, facebook followers, instagram followers, reddit mentions, stocktwits mentions, stocktwits subscribers, twitter followers, twitter mentions, x mentions, youtube subscribers, news mentions, customer reviews, lobbying cost, business outlook & linkedin employees.
What is the Market Cap of Novo Nordisk?
The Market Cap of Novo Nordisk is $237B.
What is Novo Nordisk's PE Ratio?
As of today, Novo Nordisk's PE (Price to Earnings) ratio is 13.72.
When does Novo Nordisk report earnings?
Novo Nordisk will report its next earnings on November 5 '25.
What is the current stock price of Novo Nordisk?
Currently, the price of one share of Novo Nordisk stock is $52.96.
How can I analyze the NVO stock price chart for investment decisions?
The NVO stock price chart above provides a comprehensive visual representation of Novo Nordisk's stock performance over time. Investors can use this chart to identify patterns, trends, and potential support or resistance levels. By examining historical data and recent price movements, investors can make more informed decisions regarding buying, holding, or selling Novo Nordisk shares. Our platform offers an up-to-date NVO stock price chart, along with technical data analysis and alternative data insights.
Does NVO offer dividends to its shareholders?
Yes, Novo Nordisk (NVO) offers dividends to its shareholders, with a dividend yield of 3.24%. This dividend yield represents Novo Nordisk's commitment to providing value to its shareholders through both potential capital appreciation and steady income. Investors considering Novo Nordisk in their portfolio should factor in this dividend policy alongside the company's growth prospects and market position.
What are some of the similar stocks of Novo Nordisk?
Some of the similar stocks of Novo Nordisk are Johnson & Johnson, Eli Lilly and Company, Pfizer, Astrazeneca, and AbbVie.
.
