Data gathered: October 25
Alternative Data for Sunoco
| Alternative Data | Value | 3m Change | Trend | Benchmark |
|---|---|---|---|---|
| Job Posts | 82 | Sign up | Sign up | Sign up |
| Sentiment | 84 | Sign up | Sign up | Sign up |
| Webpage traffic | 155,000 | Sign up | Sign up | Sign up |
| Employee Rating | 74 | Sign up | Sign up | Sign up |
| Google Trends | N/A | Sign up | Sign up | Sign up |
| Patents | N/A | Sign up | Sign up | Sign up |
| App Downloads | 100 | Sign up | Sign up | Sign up |
| 4chan Mentions | N/A | Sign up | Sign up | Sign up |
| Facebook Engagement | 9 | Sign up | Sign up | Sign up |
| Facebook Followers | 364,262 | Sign up | Sign up | Sign up |
| Instagram Followers | 68,996 | Sign up | Sign up | Sign up |
| Reddit Mentions | N/A | Sign up | Sign up | Sign up |
| Stocktwits Mentions | N/A | Sign up | Sign up | Sign up |
| Stocktwits Subscribers | 2,639 | Sign up | Sign up | Sign up |
| Tiktok Followers | N/A | Sign up | Sign up | Sign up |
| Twitter Mentions | N/A | Sign up | Sign up | Sign up |
| X Mentions | 24 | Sign up | Sign up | Sign up |
| News Mentions | N/A | Sign up | Sign up | Sign up |
| Customer reviews | N/A | Sign up | Sign up | Sign up |
| Business Outlook | 48 | Sign up | Sign up | Sign up |
| Linkedin Employees | 4,125 | Sign up | Sign up | Sign up |
About Sunoco
Sunoco LP is an American master limited partnership organized under Delaware state laws and headquartered in Dallas, Texas. Dating back to 1886, the company has transitioned from a vertically integrated energy company to a distributor of fuels.

| Price | $53.71 |
| Target Price | Sign up |
| Volume | 292,420 |
| Market Cap | $7.41B |
| Year Range | $48.42 - $57.26 |
| Dividend Yield | 6.55% |
| PE Ratio | 46.73 |
| Analyst Rating | 80% buy |
| Earnings Date | November 5 '25 |
| Industry | Oil & Gas |
In the news
Sunoco (SUN) Gains Amid Positive Update Regarding Parkland TakeoverOctober 20 - Yahoo Entertainment |
|
 |
Sunoco LP Announces a 1.25% Increase in Quarterly Distribution and Continues to Target 2025 Distribution Growth Rate of At Least 5%October 20 - Yahoo |
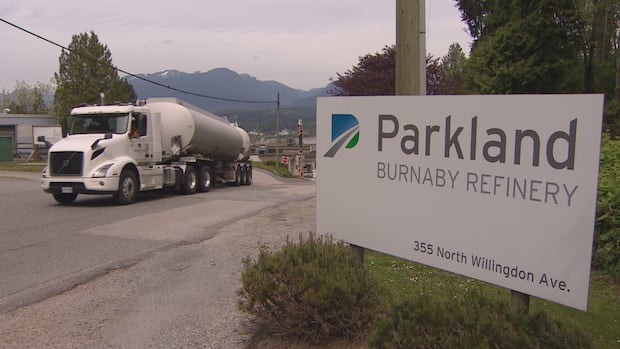 |
$9.1B Parkland-Sunoco deal gets Investment Canada Act approvalOctober 17 - CBC News |
Parkland-Sunoco deal receives Investment Canada Act approvalOctober 17 - Financial Post |
|
|
Sunoco LP (SUN) Beats Stock Market Upswing: What Investors Need to KnowOctober 17 - Yahoo |
|
Wall Street Bulls Look Optimistic About Sunoco LP (SUN): Should You Buy?October 16 - Yahoo |
Financial performance View All
| Revenue | Cost of Revenue | Gross Profit | Net Income | ebitda | EPS | |
|---|---|---|---|---|---|---|
| Q2 '25 | 5.39B | 4.67B | 725M | 127M | 370M | 0.330 |
| Q1 '25 | 5.18B | 4.68B | 497M | 166M | 482M | 1.210 |
| Q4 '24 | 5.27B | 4.8B | 473M | 103M | -368M | 0.750 |
| Q3 '24 | 5.75B | 5.42B | 329M | -35M | 228M | 0.260 |
| Q2 '24 | 6.17B | 5.69B | 481M | 455M | 823M | 3.850 |
Insider Transactions View All
| Harkness Austin filed to buy 83,686 shares at $49.7. May 31 '24 |
| Fails Karl R filed to buy 230,916 shares at $50.2. May 29 '24 |
| Hand Brian A filed to buy 153,255 shares at $49.6. May 29 '24 |
| Kim Joseph filed to buy 10,000 shares at $50.5. May 28 '24 |
| Skidmore David K filed to buy 13,708 shares at $52.1. April 19 '24 |
Similar companies
| Company | Price | AI Score | |
|---|---|---|---|
 |
ExxonMobilXOM |
$115.39 0% | 47 |
 |
Occidental PetroleumOXY |
$42.57 0% | 58 |
 |
BPBP |
$34.54 0% | 30 |
 |
ChevronCVX |
$155.56 0% | 47 |
 |
Hess CorporationHES |
$148.97 0% | 24 |
Read more about Sunoco (SUN) and their ai stock analysis, price prediction, earnings, congress trading, insider transactions, technical analysis, job posts, sentiment, webpage traffic, employee rating, google trends, patents, app downloads, 4chan mentions, facebook engagement, facebook followers, instagram followers, reddit mentions, stocktwits mentions, stocktwits subscribers, tiktok followers, twitter mentions, x mentions, news mentions, customer reviews, business outlook & linkedin employees.
What is the Market Cap of Sunoco?
The Market Cap of Sunoco is $7.41B.
What is Sunoco's PE Ratio?
As of today, Sunoco's PE (Price to Earnings) ratio is 46.73.
When does Sunoco report earnings?
Sunoco will report its next earnings on November 5 '25.
What is the current stock price of Sunoco?
Currently, the price of one share of Sunoco stock is $53.71.
How can I analyze the SUN stock price chart for investment decisions?
The SUN stock price chart above provides a comprehensive visual representation of Sunoco's stock performance over time. Investors can use this chart to identify patterns, trends, and potential support or resistance levels. By examining historical data and recent price movements, investors can make more informed decisions regarding buying, holding, or selling Sunoco shares. Our platform offers an up-to-date SUN stock price chart, along with technical data analysis and alternative data insights.
Does SUN offer dividends to its shareholders?
Yes, Sunoco (SUN) offers dividends to its shareholders, with a dividend yield of 6.55%. This dividend yield represents Sunoco's commitment to providing value to its shareholders through both potential capital appreciation and steady income. Investors considering Sunoco in their portfolio should factor in this dividend policy alongside the company's growth prospects and market position.
What are some of the similar stocks of Sunoco?
Some of the similar stocks of Sunoco are ExxonMobil, Occidental Petroleum, BP, Chevron, and Hess Corporation.
.
