Data gathered: October 23
Alternative Data for Crocs
About Crocs
Crocs Inc is engaged in the design, development, manufacturing, marketing and distribution of consumer products including footwear and accessories for men, women and children. The business activity is functioned through retail chains.

| Price | $85.15 |
| Target Price | Sign up |
| Volume | 999,210 |
| Market Cap | $4.63B |
| Year Range | $74.39 - $120.26 |
| Dividend Yield | 0% |
| PE Ratio | 22.83 |
| Analyst Rating | 57% buy |
| Earnings Date | October 30 '25 |
| Industry | Retail - Apparel |
In the news
 |
T-Pain Finally Drops ‘The Boots With the Fur’… And They’re CrocsOctober 23 - Rolling Stone |
Champs Sports: Crocs Footwear & Jibbitz From $4.99 (Up to ~85% Off) (0 replies)October 23 - Slickdeals.net |
|
 |
Crocs, Inc. (CROX): A Bull Case TheoryOctober 23 - Yahoo Entertainment |
 |
13 incredible and absurd brand collaborations with CrocsOctober 23 - The Daily Dot |
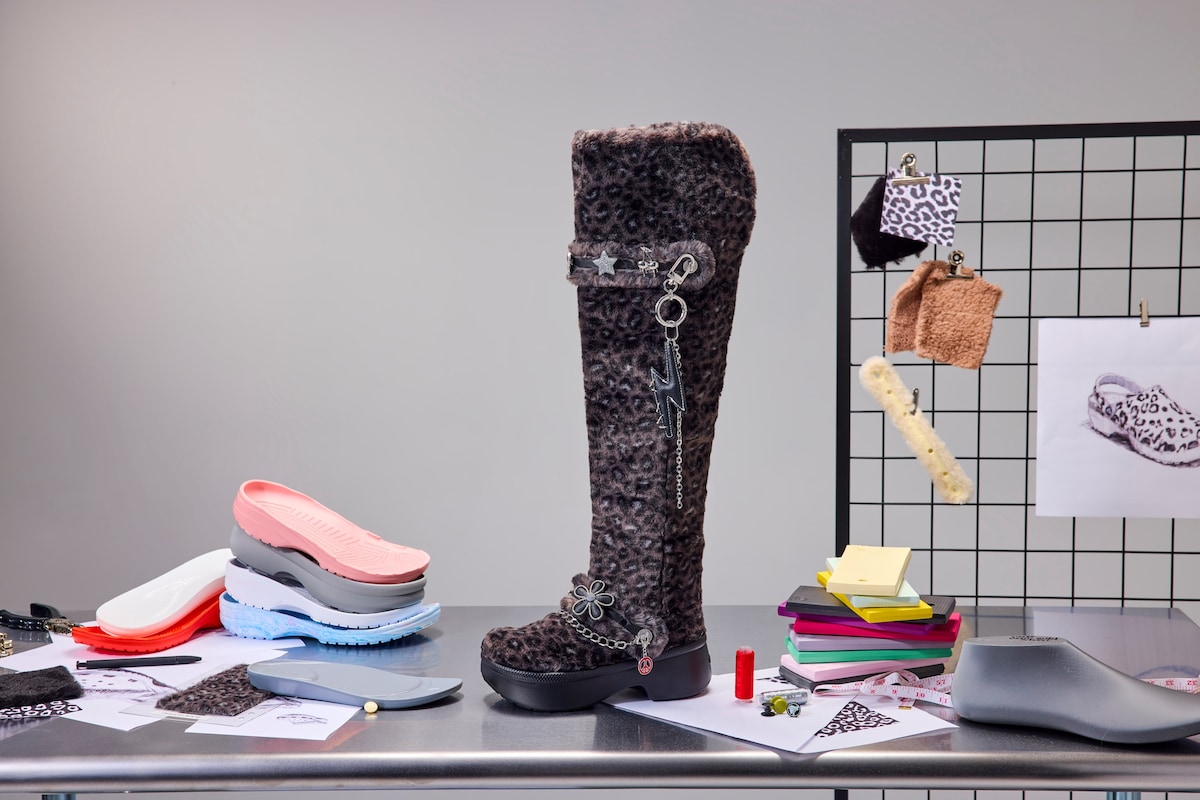 |
Tried and tested: taking Crocs new boots on a trial through LondonOctober 23 - Dazed |
 |
How Crocs Became the Right Fit for China’s Gen ZOctober 22 - Biztoc.com |
Financial performance View All
| Revenue | Cost of Revenue | Gross Profit | Net Income | ebitda | EPS | |
|---|---|---|---|---|---|---|
| Q2 '25 | 1.15B | 441M | 709M | -492M | -407M | 4.230 |
| Q1 '25 | 937M | 396M | 542M | 160M | 246M | 3.000 |
| Q4 '24 | 990M | 417M | 573M | 369M | 217M | 2.520 |
| Q3 '24 | 1.06B | 429M | 633M | 200M | 289M | 3.600 |
| Q2 '24 | 1.11B | 430M | 682M | 229M | 343M | 4.010 |
Insider Transactions View All
| Healy Susan L. filed to buy 50,078 shares at $76.6. August 14 '25 |
| REPLOGLE JOHN B filed to buy 12,492 shares at $76.3. August 13 '25 |
| REPLOGLE JOHN B filed to buy 15,417 shares at $76.7. August 13 '25 |
| Bickley Ian filed to sell 27,505 shares at $115.9. May 13 '25 |
| SMACH THOMAS J filed to sell 109,458 shares at $109.5. May 13 '25 |
Similar companies
| Company | Price | AI Score | |
|---|---|---|---|
 |
NikeNKE |
$69.68 0.9% | 36 |
 |
Steven MaddenSHOO |
$35.62 3.3% | 44 |
 |
SkechersSKX |
$63.13 0% | 28 |
 |
Under ArmourUAA |
$4.85 1.5% | 30 |
 |
Foot LockerFL |
$24.01 0% | 28 |
Read more about Crocs (CROX) and their ai stock analysis, price prediction, earnings, congress trading, insider transactions, technical analysis, job posts, sentiment, webpage traffic, employee rating, google trends, patents, 4chan mentions, facebook engagement, facebook followers, instagram followers, pinterest followers, reddit mentions, reddit subscribers, stocktwits mentions, stocktwits subscribers, threads followers, tiktok followers, twitter followers, twitter mentions, x mentions, news mentions, customer reviews, business outlook & linkedin employees.
What is the Market Cap of Crocs?
The Market Cap of Crocs is $4.63B.
What is Crocs' PE Ratio?
As of today, Crocs' PE (Price to Earnings) ratio is 22.83.
When does Crocs report earnings?
Crocs will report its next earnings on October 30 '25.
What is the current stock price of Crocs?
Currently, the price of one share of Crocs stock is $85.15.
How can I analyze the CROX stock price chart for investment decisions?
The CROX stock price chart above provides a comprehensive visual representation of Crocs' stock performance over time. Investors can use this chart to identify patterns, trends, and potential support or resistance levels. By examining historical data and recent price movements, investors can make more informed decisions regarding buying, holding, or selling Crocs shares. Our platform offers an up-to-date CROX stock price chart, along with technical data analysis and alternative data insights.
Does CROX offer dividends to its shareholders?
As of our latest update, Crocs (CROX) does not offer dividends to its shareholders. Investors interested in Crocs should consider the potential for capital appreciation as the primary return on investment, rather than expecting dividend payouts.
What are some of the similar stocks of Crocs?
Some of the similar stocks of Crocs are Nike, Steven Madden, Skechers, Under Armour, and Foot Locker.
.
