Data gathered: December 23
Alternative Data for Grocery Outlet
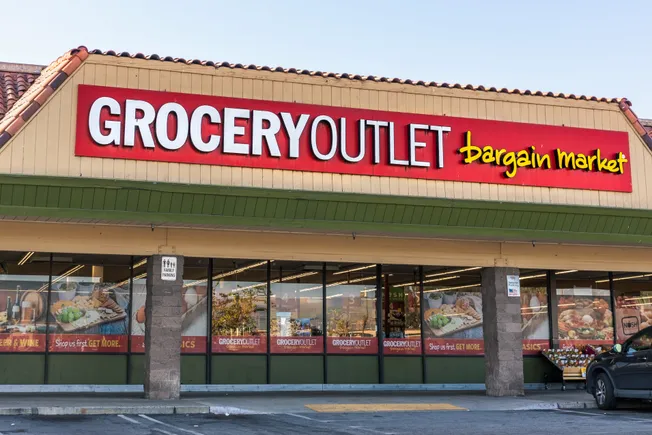
About Grocery Outlet
Grocery Outlet is an American discount closeout retailer consisting exclusively of supermarket locations that offer deeply discounted, overstocked, and closeout products from name brand and private label suppliers.

| Price | $16.73 |
| Target Price | Sign up |
| Volume | 2,560,000 |
| Market Cap | $1.63B |
| Year Range | $13.9 - $27.44 |
| Dividend Yield | 0% |
| PE Ratio | 32.8 |
| Analyst Rating | 17% buy |
| Industry | Retail |
In the news
Barclays PLC Acquires 277,706 Shares of Grocery Outlet Holding Corp. (NASDAQ:GO)December 21 - ETF Daily News |
|
Public Employees Retirement System of Ohio Has $653,000 Stake in Grocery Outlet Holding Corp. (NASDAQ:GO)December 21 - ETF Daily News |
|
 |
Grocery Outlet names new CFODecember 19 - Yahoo |
 |
Grocery Outlet names Christopher Miller as new CFODecember 18 - Thefly.com |
 |
Grocery Outlet Holding Corp. Announces Appointment of New Chief Financial OfficerDecember 18 - Yahoo |
Grocery Outlet : Announces Appointment of New Chief Financial Officer Form 8 KDecember 18 - Finnhub |
|
Financial performance View All
| Revenue | Cost of Revenue | Gross Profit | Net Income | ebitda | EPS | |
|---|---|---|---|---|---|---|
| Q3 '24 | 1.11B | 1.07B | 345M | 24M | 0 | 0.280 |
| Q2 '24 | 1.13B | 1.1B | 349M | 14M | 53M | 0.250 |
| Q1 '24 | 1.03B | 1.04B | 304M | -1M | 25M | 0.090 |
| Q4 '23 | 987M | 982M | 299M | 14M | 43M | 0.180 |
| Q3 '23 | 998M | 966M | 316M | 27M | 59M | 0.310 |
Insider Transactions View All
| Ragatz Erik D. filed to buy 539,785 shares at $18.3. November 18 '24 |
| Lindberg Eric J. Jr. filed to sell 70,938 shares at $16.3. September 23 '24 |
| Lindberg Eric J. Jr. filed to sell 70,938 shares at $18.4. August 22 '24 |
| Lindberg Eric J. Jr. filed to sell 70,938 shares at $18.8. August 20 '24 |
| Thompson Luke D filed to sell 32,306 shares at $22.4. May 22 '24 |
Similar companies
| Company | Price | AI Score | |
|---|---|---|---|
 |
CostcoCOST |
$954.07 0% | 64 |
 |
Dollar TreeDLTR |
$72.94 0% | 29 |
 |
TargetTGT |
$131.48 0% | 54 |
 |
Big LotsBIG |
$0.5 0% | 37 |
 |
Macy'sM |
$16.24 0% | 54 |
Read more about Grocery Outlet (GO) and their ai stock analysis, price prediction, earnings, congress trading, insider transactions, technical analysis, job posts, sentiment, webpage traffic, employee rating, google trends, patents, 4chan mentions, facebook engagement, facebook followers, instagram followers, pinterest followers, reddit mentions, stocktwits mentions, stocktwits subscribers, tiktok followers, twitter followers, twitter mentions, youtube subscribers, news mentions, customer reviews, business outlook & linkedin employees.
What is the Market Cap of Grocery Outlet?
The Market Cap of Grocery Outlet is $1.63B.
What is Grocery Outlet's PE Ratio?
As of today, Grocery Outlet's PE (Price to Earnings) ratio is 32.8.
What is the current stock price of Grocery Outlet?
Currently, the price of one share of Grocery Outlet stock is $16.73.
How can I analyze the GO stock price chart for investment decisions?
The GO stock price chart above provides a comprehensive visual representation of Grocery Outlet's stock performance over time. Investors can use this chart to identify patterns, trends, and potential support or resistance levels. By examining historical data and recent price movements, investors can make more informed decisions regarding buying, holding, or selling Grocery Outlet shares. Our platform offers an up-to-date GO stock price chart, along with technical data analysis and alternative data insights.
Does GO offer dividends to its shareholders?
As of our latest update, Grocery Outlet (GO) does not offer dividends to its shareholders. Investors interested in Grocery Outlet should consider the potential for capital appreciation as the primary return on investment, rather than expecting dividend payouts.
What are some of the similar stocks of Grocery Outlet?
Some of the similar stocks of Grocery Outlet are Costco, Dollar Tree, Target, Big Lots, and Macy's.
.