Data gathered: October 5
AI Stock Analysis - Intel (INTC)
Analysis generated September 26, 2025. Powered by Chat GPT.
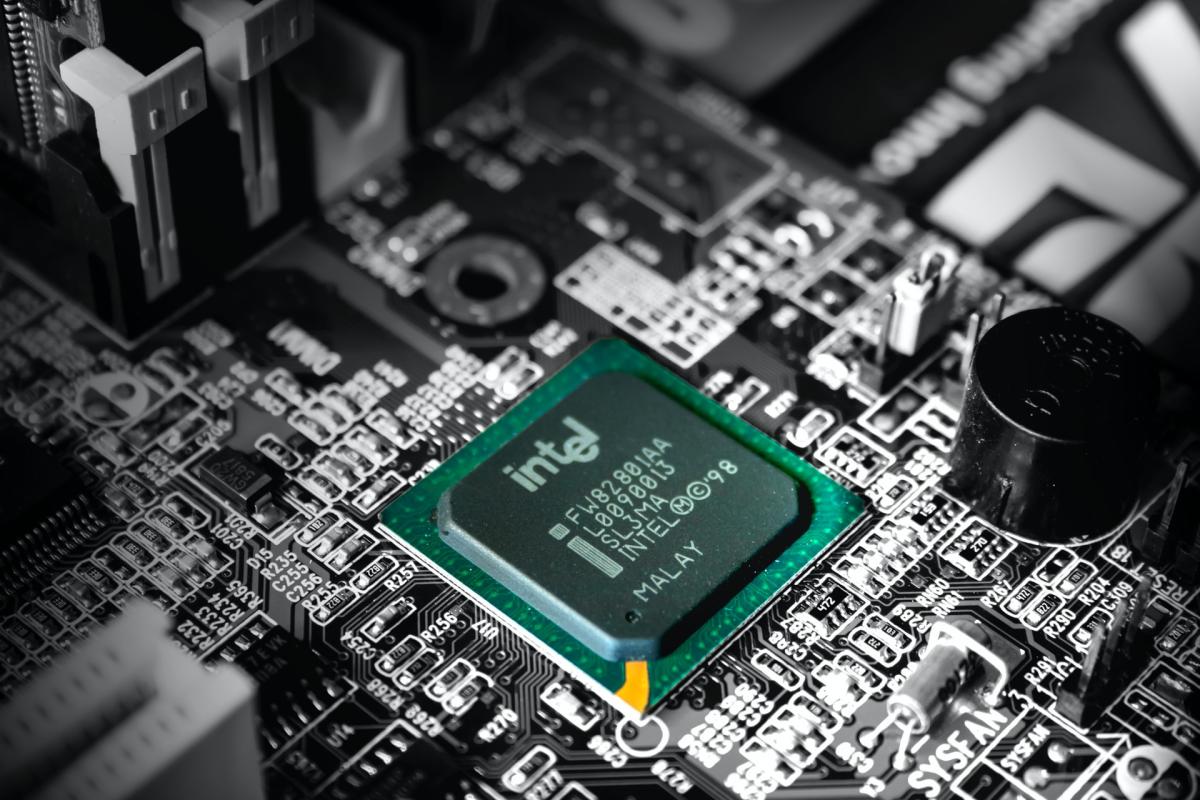
Intel Corporation, founded in 1968, is a leading American multinational corporation and technology company headquartered in Santa Clara, California. Intel is renowned for inventing the x86 series of microprocessors, which are found in most personal computers. As an essential player in the semiconductor industry, Intel supplies processors for computer system manufacturers such as Lenovo, HP, and Dell. Intel's product portfolio includes a range of processors, chipsets, integrated graphics, and IoT solutions, catering to both consumer and enterprise markets.
Stock Alerts - Intel (INTC)
 |
Intel | October 1 Price is up by 6.2% in the last 24h. |
|
Intel | October 1 Job postings are down by 45.5% in the last couple of days. |
|
Intel | September 29 Job postings are down by 31.7% in the last couple of days. |
|
Intel | September 26 Price is up by 6.1% in the last 24h. |
Download our app to get future alerts delivered in real-time.
Alternative Data for Intel
About Intel
Intel Corp is the world's largest chipmaker. It engaged in making a semiconductor chip. It designs and manufactures integrated digital technology products like integrated circuits, for industries such as computing and communications.
| Price | $36.83 |
| Target Price | Sign up |
| Volume | 125,360,000 |
| Market Cap | $175B |
| Year Range | $18.13 - $37.3 |
| Dividend Yield | 0% |
| PE Ratio | 89.67 |
| Analyst Rating | 3% buy |
| Industry | Semiconductor |
In the news
 |
Weekly Market Wrap: Intel, Nvidia and Electronic Arts made major newsOctober 4 - TheStreet |
 |
Jim Cramer on Intel: “There’s an Amazing Comeback Story”October 4 - Yahoo Entertainment |
 |
Intel Is the “Insurance Policy” For Every US Fabless Chip Firms Like Apple, NVIDIA & AMD Against Supply Risks Around TSMC, Says Renowned AnalystOctober 4 - Wccftech |
Many Debian/Ubuntu Packages For Intel Accelerators & Other Intel Software Have Been OrphanedOctober 4 - Phoronix |
|
 |
Maxsun Intros Powerful AI Workstation PC, Featuring Up To Four Intel Arc Pro B60 48G Turbo GPUs, Bringing A Massive 192 GB VRAM CapacityOctober 4 - Wccftech |
 |
Hell freezes over: AMD may team up with Intel to produce chips - but I don't expect Intel foundries to push out Ryzen CPUs anytime soonOctober 4 - TechRadar |
Financial performance View All
| Revenue | Cost of Revenue | Gross Profit | Net Income | ebitda | EPS | |
|---|---|---|---|---|---|---|
| Q2 '25 | 12.9B | 9.32B | 3.54B | -2.92B | 471M | -0.100 |
| Q1 '25 | 12.7B | 8B | 4.67B | -821M | 2.39B | 0.130 |
| Q4 '24 | 14.3B | 8.68B | 5.58B | -126M | 3.48B | 0.130 |
| Q3 '24 | 13.3B | 11.3B | 2B | -16.6B | -5.23B | -0.460 |
| Q2 '24 | 12.8B | 8.29B | 4.55B | -1.61B | 859M | 0.020 |
Insider Transactions View All
| Holthaus Michelle Johnston filed to sell 273,258 shares at $26. November 8 '24 |
| GELSINGER PATRICK P filed to buy 105,033 shares at $22.5. November 6 '24 |
| GELSINGER PATRICK P filed to buy 37,975 shares at $19.9. August 7 '24 |
| GELSINGER PATRICK P filed to buy 32,975 shares at $20.3. August 7 '24 |
| GELSINGER PATRICK P filed to buy 39,375 shares at $30.3. May 2 '24 |
Similar companies
| Company | Price | AI Score | |
|---|---|---|---|
 |
AMDAMD |
$164.67 0% | 48 |
 |
Microchip TechnologyMCHP |
$66.54 0% | 48 |
 |
NVIDIANVDA |
$187.62 0% | 69 |
 |
Texas InstrumentsTXN |
$180.32 0% | 57 |
 |
QUALCOMMQCOM |
$169.18 0% | 54 |
Congress Trading View All
| Politician | Filing Date | Type | Size |
|---|---|---|---|
| Tim Moore |
Sep 4, 25 | Buy | $15K - $50K |
| Tim Moore |
Sep 4, 25 | Buy | $15K - $50K |
| Tim Moore |
Sep 4, 25 | Buy | $15K - $50K |
Read more about Intel (INTC) and their ai stock analysis, price prediction, earnings, congress trading, insider transactions, technical analysis, job posts, sentiment, webpage traffic, employee rating, google trends, patents, app downloads, 4chan mentions, facebook engagement, facebook followers, instagram followers, pinterest followers, reddit mentions, reddit subscribers, stocktwits mentions, stocktwits subscribers, threads followers, tiktok followers, twitter followers, twitter mentions, x mentions, youtube subscribers, news mentions, customer reviews, lobbying cost, business outlook & linkedin employees.
What is the Market Cap of Intel?
The Market Cap of Intel is $175B.
What is Intel's PE Ratio?
As of today, Intel's PE (Price to Earnings) ratio is 89.67.
What is the current stock price of Intel?
Currently, the price of one share of Intel stock is $36.83.
How can I analyze the INTC stock price chart for investment decisions?
The INTC stock price chart above provides a comprehensive visual representation of Intel's stock performance over time. Investors can use this chart to identify patterns, trends, and potential support or resistance levels. By examining historical data and recent price movements, investors can make more informed decisions regarding buying, holding, or selling Intel shares. Our platform offers an up-to-date INTC stock price chart, along with technical data analysis and alternative data insights.
Does INTC offer dividends to its shareholders?
As of our latest update, Intel (INTC) does not offer dividends to its shareholders. Investors interested in Intel should consider the potential for capital appreciation as the primary return on investment, rather than expecting dividend payouts.
What are some of the similar stocks of Intel?
Some of the similar stocks of Intel are AMD, Microchip Technology, NVIDIA, Texas Instruments, and QUALCOMM.
.