Data gathered: January 31
Alternative Data for Lifeway Kefir
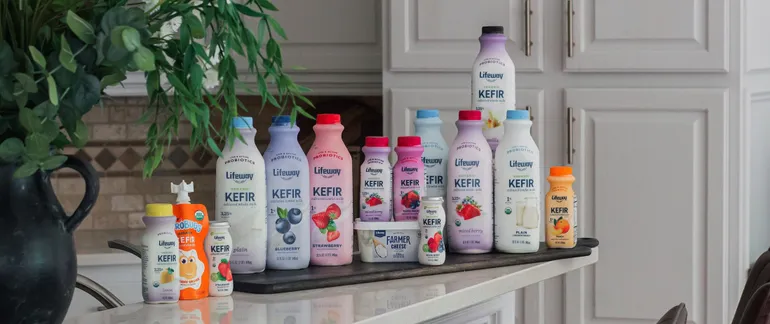
About Lifeway Kefir
Lifeway Foods Inc is engaged in manufacturing probiotic, cultured, functional dairy health food products. Its primary product is drinkable kefir which is a cultured dairy product. Its product categories are Drinkable Kefir which is the key revenue-driving product, European-style soft cheeses, Cream, ProBugs, Frozen Kefir and Other dairy. The company manufacture and market products under the Lifeway and Fresh Made brand names, as well as under private labels on behalf of customers. It sells the products primarily through direct sales force, brokers, and distributors.

| Price | $23.04 |
| Target Price | Sign up |
| Volume | 58,540 |
| Market Cap | $345M |
| Year Range | $10.8 - $26.73 |
| Dividend Yield | 0% |
| PE Ratio | 27.08 |
| Analyst Rating | 50% buy |
| Industry | Consumer Packaged Goods |
In the news
 |
Lifeway insists Danone investor agreement “invalid”January 6 - Yahoo |
Lifeway Foods Reaffirms Rejection of Danone's Takeover OfferJanuary 5 - Yahoo |
|
 |
LIFEWAY FOODS RESPONDS TO LETTER FROM DANONE REAFFIRMING REJECTION OF UNSOLICITED TAKEOVER OFFER AND THAT 1999 STOCKHOLDER AGREEMENT SHOULD BE VOIDED FOR VIOLATING ILLINOIS LAWJanuary 5 - Yahoo |
 |
Lifeway broke investor deal with CEO share award, Danone claimsJanuary 5 - Yahoo |
 |
Danone accuses Lifeway of allowing its CEO to engage in ‘self-dealing’ and ‘value destruction’January 5 - Yahoo |
Financial performance View All
| Revenue | Cost of Revenue | Gross Profit | Net Income | ebitda | EPS | |
|---|---|---|---|---|---|---|
| Q3 '24 | 46M | 44M | 12M | 3M | 4.3M | 0.195 |
| Q2 '24 | 49M | 45M | 13M | 3.8M | 5.5M | 0.250 |
| Q1 '24 | 45M | 42M | 12M | 2.4M | 3.7M | 0.160 |
| Q4 '23 | 42M | 37M | 12M | 4M | 5.9M | 0.260 |
| Q3 '23 | 41M | 37M | 11M | 3.4M | 5.2M | 0.230 |
Insider Transactions View All
| SMOLYANSKY LUDMILA filed to sell 965,823 shares at $22.6. January 17 '25 |
| SMOLYANSKY LUDMILA filed to sell 977,857 shares at $22.6. January 17 '25 |
| SMOLYANSKY LUDMILA filed to sell 985,549 shares at $22.7. January 17 '25 |
| SMOLYANSKY LUDMILA filed to sell 995,549 shares at $22.5. January 15 '25 |
| SMOLYANSKY LUDMILA filed to sell 1,005,549 shares at $22.1. January 15 '25 |
Similar companies


Read more about Lifeway Kefir (LWAY) and their ai stock analysis, price prediction, earnings, congress trading, insider transactions, technical analysis, job posts, sentiment, webpage traffic, employee rating, google trends, patents, 4chan mentions, facebook engagement, facebook followers, instagram followers, reddit mentions, stocktwits mentions, stocktwits subscribers, tiktok followers, twitter followers, twitter mentions, youtube subscribers, news mentions, customer reviews, business outlook & linkedin employees.
What is the Market Cap of Lifeway Kefir?
The Market Cap of Lifeway Kefir is $345M.
What is Lifeway Kefir's PE Ratio?
As of today, Lifeway Kefir's PE (Price to Earnings) ratio is 27.08.
What is the current stock price of Lifeway Kefir?
Currently, the price of one share of Lifeway Kefir stock is $23.04.
How can I analyze the LWAY stock price chart for investment decisions?
The LWAY stock price chart above provides a comprehensive visual representation of Lifeway Kefir's stock performance over time. Investors can use this chart to identify patterns, trends, and potential support or resistance levels. By examining historical data and recent price movements, investors can make more informed decisions regarding buying, holding, or selling Lifeway Kefir shares. Our platform offers an up-to-date LWAY stock price chart, along with technical data analysis and alternative data insights.
Does LWAY offer dividends to its shareholders?
As of our latest update, Lifeway Kefir (LWAY) does not offer dividends to its shareholders. Investors interested in Lifeway Kefir should consider the potential for capital appreciation as the primary return on investment, rather than expecting dividend payouts.
What are some of the similar stocks of Lifeway Kefir?
Some of the similar stocks of Lifeway Kefir are Unilever PLC, Procter & Gamble, Tyson Foods, The Hershey Company, and Beyond Meat.
.