Data gathered: September 18
Alternative Data for McDonald's
About McDonald's
McDonald's Corp operates a chain of restaurants with approximately 37,200 restaurants in 120 countries. It also receives franchise royalties, and licensing pacts. The company offers a uniform value-priced menu with special additions based on regions.

| Price | $301.14 |
| Target Price | Sign up |
| Volume | 4,630,000 |
| Market Cap | $218B |
| Year Range | $275.02 - $317.7 |
| Dividend Yield | 2.3% |
| PE Ratio | 26.11 |
| Analyst Rating | 64% buy |
| Industry | Restaurants |
In the news
National Cheeseburger Day Offers: McDonald's: Double Cheeseburger $0.50 (Mobile App Only) & Many MoreSeptember 18 - Slickdeals.net |
|
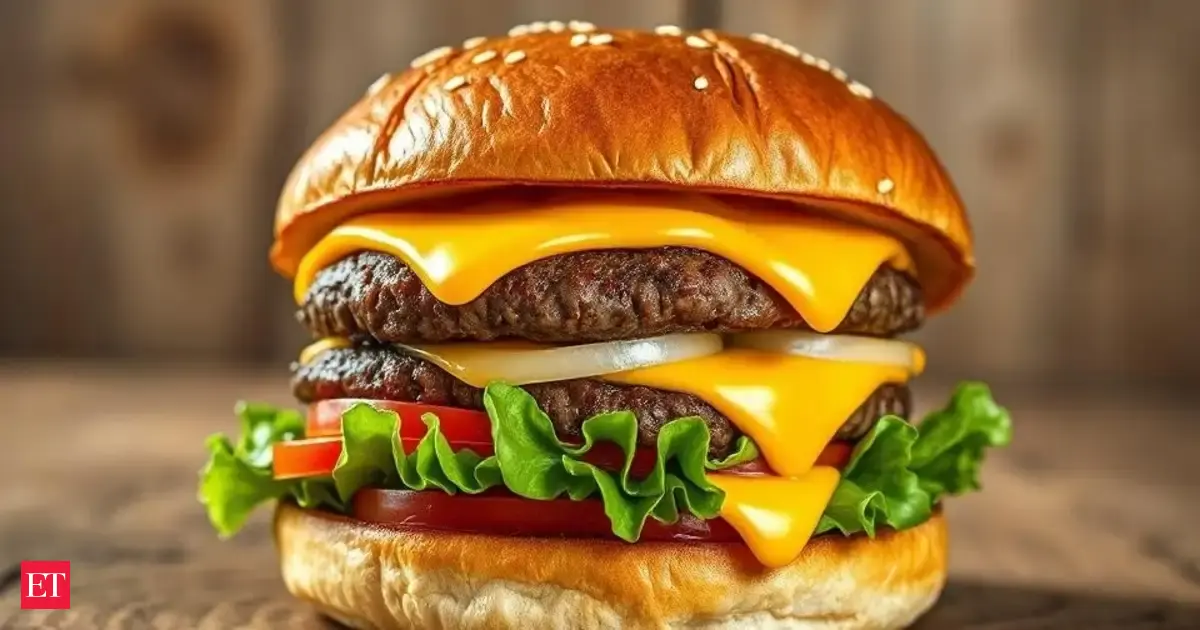 |
National Cheeseburger Day 2025 is here — Here are big discounts at McDonald's, Burger King and top fast-food chainsSeptember 18 - The Times of India |
 |
I'm landfillin' it: Inside McDonald's' troubled history with recyclingSeptember 18 - Biztoc.com |
I'm landfillin' it: Inside McDonald's' troubled history with recycling.September 18 - Business Insider |
|
 |
BTS TinyTan McDonald's Happy Meals land in Singapore: 2 editions will be released starting Sep 25September 17 - CNA |
 |
McDonald's price target raised to Street-high at CitiSeptember 17 - Thefly.com |
Financial performance View All
| Revenue | Cost of Revenue | Gross Profit | Net Income | ebitda | EPS | |
|---|---|---|---|---|---|---|
| Q2 '25 | 6.84B | 0 | 0 | 2.25B | 3.36B | 3.190 |
| Q1 '25 | 5.96B | 2.62B | 3.34B | 1.87B | 3.23B | 2.670 |
| Q4 '24 | 6.39B | 2.71B | 3.68B | 2.02B | 3.47B | 2.830 |
| Q3 '24 | 6.87B | 3B | 3.88B | 2.26B | 3.76B | 3.230 |
| Q2 '24 | 6.49B | 2.77B | 3.72B | 2.02B | 3.43B | 2.970 |
Insider Transactions View All
| Flatley Edith Morgan filed to sell 6,858 shares at $315. September 2 '25 |
| Flatley Edith Morgan filed to sell 7,858 shares at $315. August 20 '25 |
| Flatley Edith Morgan filed to sell 7,882 shares at $315. August 20 '25 |
| Banner Jonathan filed to sell 99 shares at $310. August 19 '25 |
| Ralls-Morrison Desiree filed to sell 8,754 shares at $310. August 6 '25 |
Similar companies
| Company | Price | AI Score | |
|---|---|---|---|
 |
Domino'sDPZ |
$430.08 1.9% | 46 |
 |
Denny'sDENN |
$5.2 1% | 47 |
 |
ChipotleCMG |
$39.81 0.4% | 58 |
 |
Wendy'sWEN |
$9.52 0.5% | 41 |
 |
StarbucksSBUX |
$83.42 0.2% | 40 |
Congress Trading View All
| Politician | Filing Date | Type | Size |
|---|---|---|---|
| Julie Johnson |
Sep 12, 25 | Sell | $1K - $15K |
| Lisa McClain |
Aug 13, 25 | Buy | $1K - $15K |
| Ro Khanna |
Aug 8, 25 | Sell | $15K - $50K |
Read more about McDonald's (MCD) and their ai stock analysis, price prediction, earnings, congress trading, insider transactions, technical analysis, job posts, sentiment, webpage traffic, employee rating, google trends, patents, app downloads, 4chan mentions, facebook engagement, facebook followers, instagram followers, reddit mentions, stocktwits mentions, stocktwits subscribers, threads followers, tiktok followers, twitter followers, twitter mentions, youtube subscribers, news mentions, customer reviews, lobbying cost, business outlook & linkedin employees.
What is the Market Cap of McDonald's?
The Market Cap of McDonald's is $218B.
What is McDonald's' PE Ratio?
As of today, McDonald's' PE (Price to Earnings) ratio is 26.11.
What is the current stock price of McDonald's?
Currently, the price of one share of McDonald's stock is $301.14.
How can I analyze the MCD stock price chart for investment decisions?
The MCD stock price chart above provides a comprehensive visual representation of McDonald's' stock performance over time. Investors can use this chart to identify patterns, trends, and potential support or resistance levels. By examining historical data and recent price movements, investors can make more informed decisions regarding buying, holding, or selling McDonald's shares. Our platform offers an up-to-date MCD stock price chart, along with technical data analysis and alternative data insights.
Does MCD offer dividends to its shareholders?
Yes, McDonald's (MCD) offers dividends to its shareholders, with a dividend yield of 2.3%. This dividend yield represents McDonald's' commitment to providing value to its shareholders through both potential capital appreciation and steady income. Investors considering McDonald's in their portfolio should factor in this dividend policy alongside the company's growth prospects and market position.
What are some of the similar stocks of McDonald's?
Some of the similar stocks of McDonald's are Domino's, Denny's, Chipotle, Wendy's, and Starbucks.
.