Data gathered: December 22
Alternative Data for Six Flags
About Six Flags
Six Flags Entertainment Corporation, more commonly known as Six Flags or as Six Flags Theme Parks, is an American amusement park corporation, headquartered in Arlington, Texas. It has properties in Canada, Mexico, and the United States.

| Price | $32.00 |
| Target Price | Sign up |
| Volume | 16,920,000 |
| Market Cap | $2.7B |
| Year Range | $22.42 - $33.14 |
| Dividend Yield | 0% |
| PE Ratio | 100 |
| Analyst Rating | 40% buy |
| Industry | Entertainment |
In the news
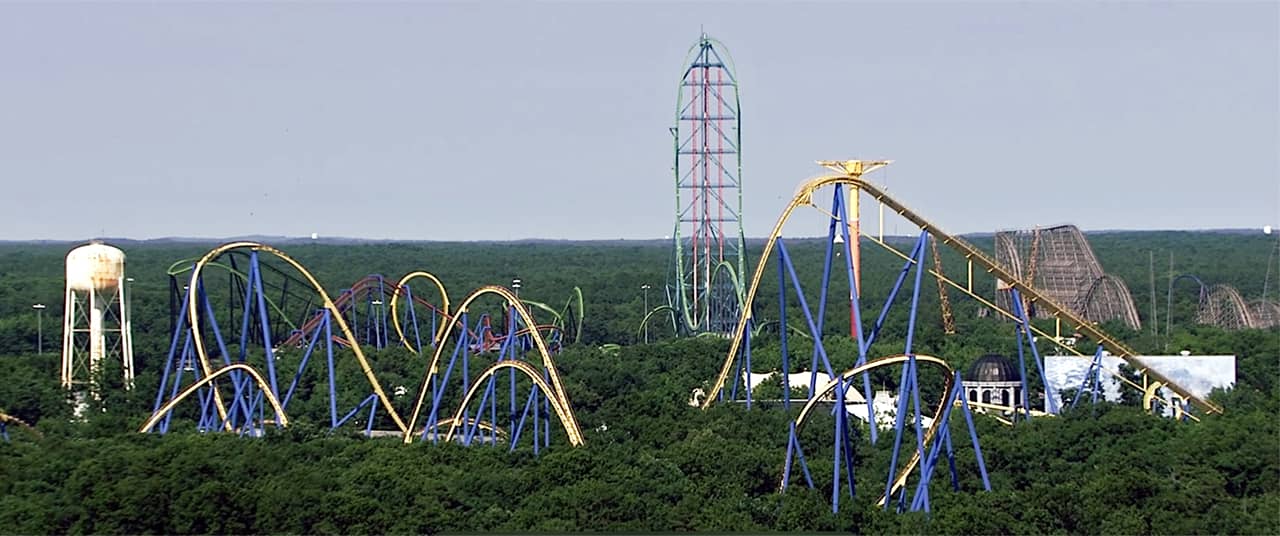 |
Six Flags files permit to 'alter' its record-setting coasterDecember 21 - Theme Park Insider |
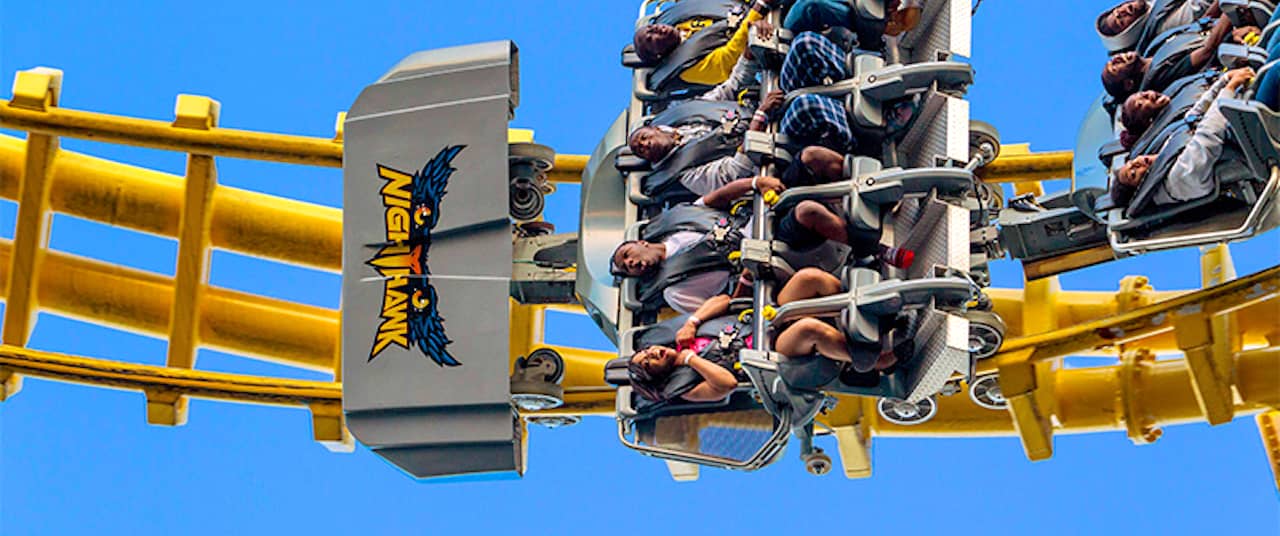 |
Six Flags closes one of its pioneering roller coastersDecember 18 - Theme Park Insider |
 |
Six Flags-Cedar Fair Merger Unlocks $200 Million In Synergies, Analyst Sees Big Growth PotentialDecember 9 - Biztoc.com |
 |
Tyga Celebrates Bday With YG, AE, Mustard, Bobbi Althoff at Six FlagsNovember 20 - TMZ |
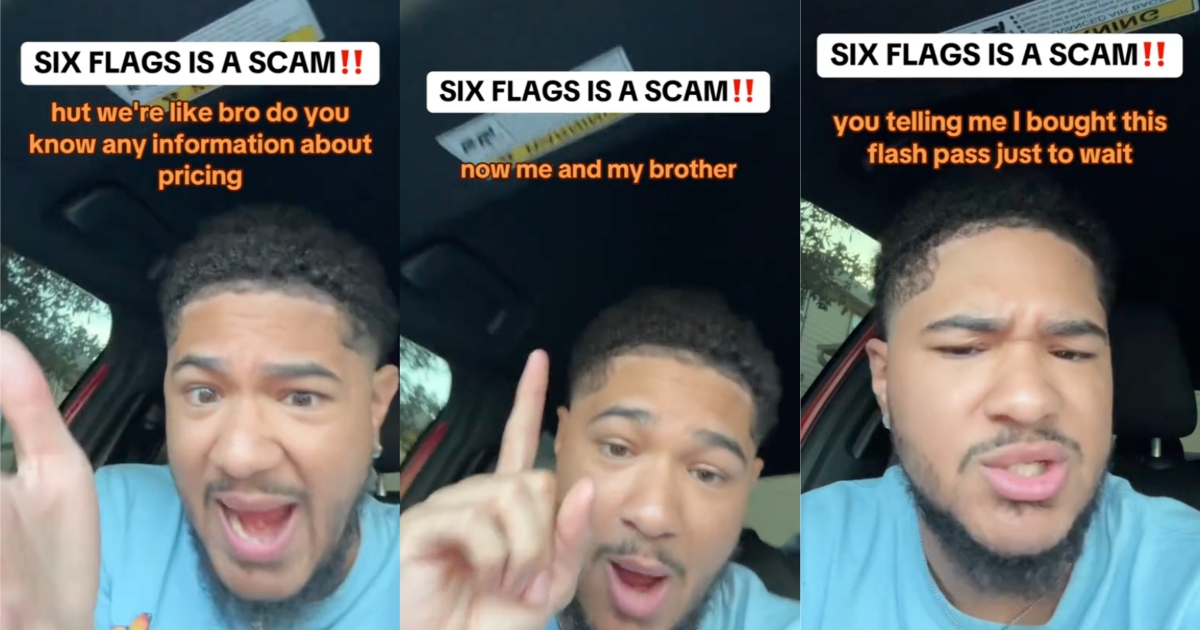 |
Six Flags’ Customer Says Their Fright Fest In San Antonio Was A Scam Because It Cost $60 More Than NormalNovember 19 - Twistedsifter.com |
 |
Kings Dominion parent Six Flags plans to invest in parks, but fans worryNovember 18 - Richmond.com |
Financial performance View All
| Revenue | Cost of Revenue | Gross Profit | Net Income | ebitda | EPS | |
|---|---|---|---|---|---|---|
| Q1 '24 | 131M | 54M | 77M | -83M | 0 | -0.980 |
| Q4 '23 | 243M | 102M | 140M | -22M | -20M | -0.270 |
| Q3 '23 | 507M | 101M | 407M | 111M | 213M | 1.320 |
| Q2 '23 | 384M | 125M | 258M | 21M | 147M | 0.250 |
| Q1 '23 | 138M | 54M | 84M | -70M | -21M | -0.840 |
Insider Transactions View All
| Sample Derek filed to sell 12,805 shares at $26.4. May 22 '24 |
| Mick Gary filed to buy 89,737 shares at $27. June 12 '23 |
| Mick Gary filed to buy 84,737 shares at $25.4. May 30 '23 |
| Mick Gary filed to buy 84,734 shares at $25.4. May 30 '23 |
Similar companies
| Company | Price | AI Score | |
|---|---|---|---|
 |
DisneyDIS |
$112.03 0% | 49 |
 |
Live NationLYV |
$133.28 0% | 50 |
 |
NetflixNFLX |
$909.05 0% | 76 |
 |
AMCAMC |
$4.18 0% | 43 |
 |
Fubo TVFUBO |
$1.39 0% | 34 |
Read more about Six Flags (SIX) and their ai stock analysis, price prediction, earnings, congress trading, insider transactions, technical analysis, job posts, sentiment, webpage traffic, employee rating, google trends, patents, app downloads, 4chan mentions, facebook engagement, facebook followers, instagram followers, reddit mentions, stocktwits mentions, stocktwits subscribers, tiktok followers, twitter followers, twitter mentions, youtube subscribers, news mentions, customer reviews, business outlook & linkedin employees.
What is the Market Cap of Six Flags?
The Market Cap of Six Flags is $2.7B.
What is Six Flags' PE Ratio?
As of today, Six Flags' PE (Price to Earnings) ratio is 100.
What is the current stock price of Six Flags?
Currently, the price of one share of Six Flags stock is $32.00.
How can I analyze the SIX stock price chart for investment decisions?
The SIX stock price chart above provides a comprehensive visual representation of Six Flags' stock performance over time. Investors can use this chart to identify patterns, trends, and potential support or resistance levels. By examining historical data and recent price movements, investors can make more informed decisions regarding buying, holding, or selling Six Flags shares. Our platform offers an up-to-date SIX stock price chart, along with technical data analysis and alternative data insights.
Does SIX offer dividends to its shareholders?
As of our latest update, Six Flags (SIX) does not offer dividends to its shareholders. Investors interested in Six Flags should consider the potential for capital appreciation as the primary return on investment, rather than expecting dividend payouts.
What are some of the similar stocks of Six Flags?
Some of the similar stocks of Six Flags are Disney, Live Nation, Netflix, AMC, and Fubo TV.
.